Triton Digital has released its monthly digital audio Top 20 Ranker for January 2016. The Ranker is a listing of the top-performing digital audio stations and networks measured by the Webcast Metrics® audience measurement platform.
Total Listening for All Measured Clients
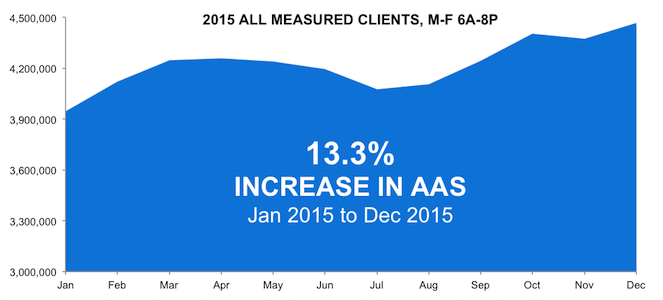
All measured clients within the Domestic U.S. reported a total of 4,493,745 Average Active Sessions (AAS) during the Monday-Friday 6:00AM-8:00PM daypart, and 3,693,236 AAS during the Monday-Sunday 6:00AM-Midnight daypart.
Taking a Closer Look
Overall streaming has seen steady growth when compared to January 2015. January 2016 Average Active Sessions (AAS) increased by 14.0 percent in the Domestic M-F 6A-8P daypart and by 11.3 percent in the Domestic M-SU 6A-Midnight daypart.
Top Formats
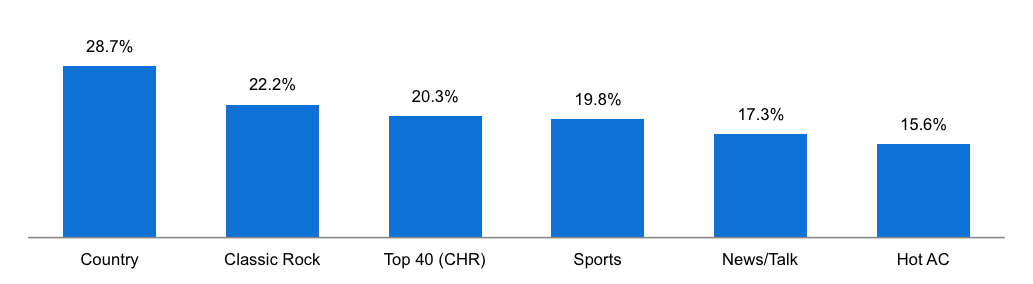
When compared to December 2015, the Country format showed the largest listening gain with a 28.7 percent increase in AAS, followed by Classic Rock (22.2 percent), Top 40 CHR (20.3 percent), Sports (19.8 percent), News/Talk (17.3 percent), and Hot AC (15.6 percent). Many of these formats had changed to the Holiday format in December.
(M-F 6A-8P)
Top Markets
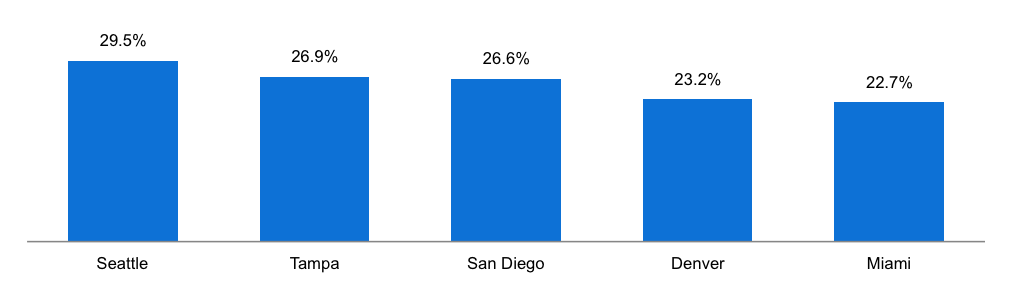
Looking at the top 20 markets, Seattle showed the largest listening gain from December 2015 with a 29.5 percent increase in AAS, followed by Tampa (26.9 percent), San Diego (26.6 percent), Denver (23.2 percent), and Miami (22.7 percent).
(M-F 6A-8P)
Top Devices
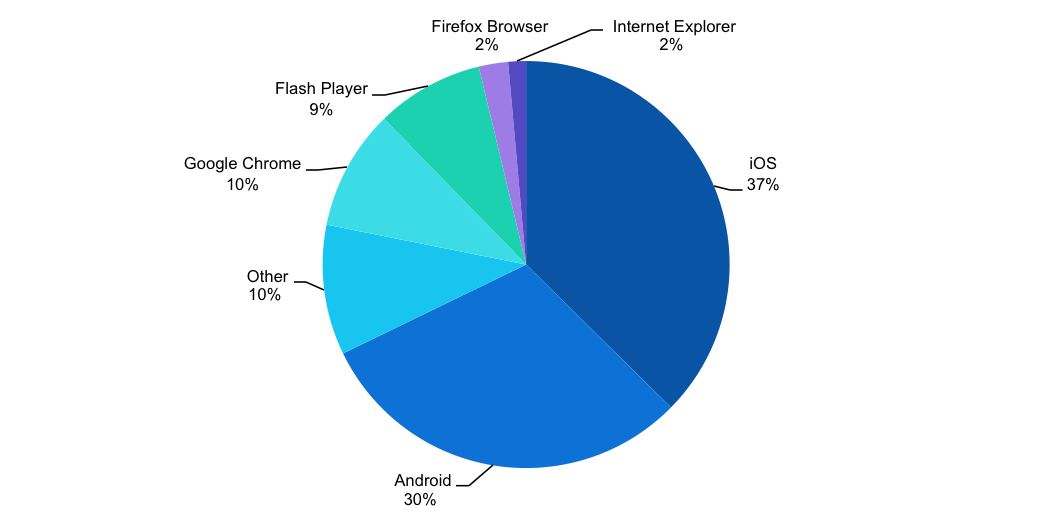
37 percent of listening taking place on an iOS device, followed by Android (30 percent) and Google Chrome (10 percent).
(M-F 6A-8P)
Top 10 Markets by Listening Device
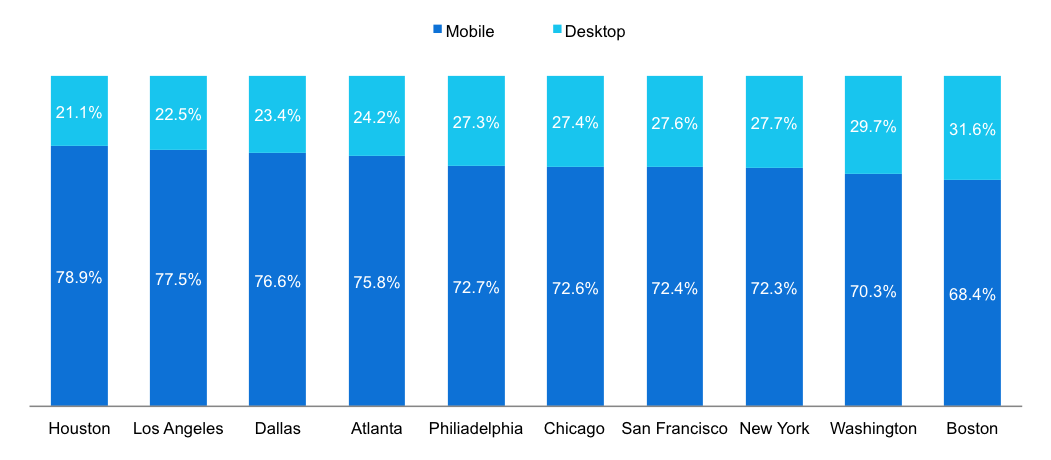
The following chart shows the top 10 markets by AAS broken out by listening device.
(M-F 6A-8P)
Listening by Hour
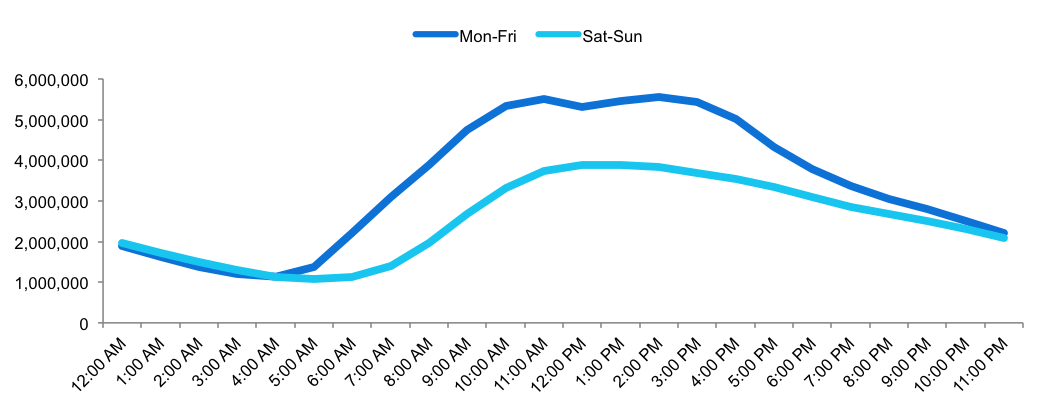
The following chart shows hourly listening by AAS broken out by weekday and weekend.
(M-F 6A-8P)