
Triton Digital has released its monthly digital audio Top 20 Ranker for February 2015. The Ranker is a listing of the top-performing digital audio stations and networks measured by the Webcast Metrics® audience measurement platform.
All Measured Clients
All measured clients in February 2015 showed 4,125,821 Average Active Sessions (AAS) within the Domestic U.S. during the Monday -Friday 6:00AM-8:00PM (M-F 6A-8P) daypart, and 3,481,328 AAS during the Monday-Sunday 6:00AM-Midnight (M-Su 6A-Mid) daypart.
Taking a Closer Look
February 2015 showed positive growth in both dayparts when compared to February 2014. AAS within the Domestic U.S. grew by 40.2 percent (M-F 6A-8P) and 43.6 percent (M-Su 6A-Mid).
Listening by Market
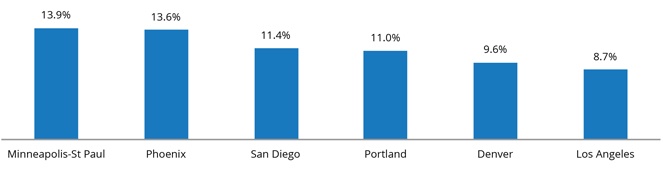
Looking at the top 20 markets, Minneapolis-St. Paul showed the largest listening gain with a 13.9 percent increase in AAS (M-F 6A-8P), followed by Phoenix, San Diego, Portland, Denver, and Los Angeles.
Growth by Format
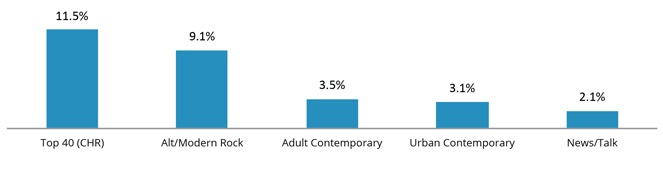
Compared to the month prior, the Top 40 (CHR) format showed the largest gains with an 11.5 percent increase in AAS (M-F 6A-8P).
Audio Consumption
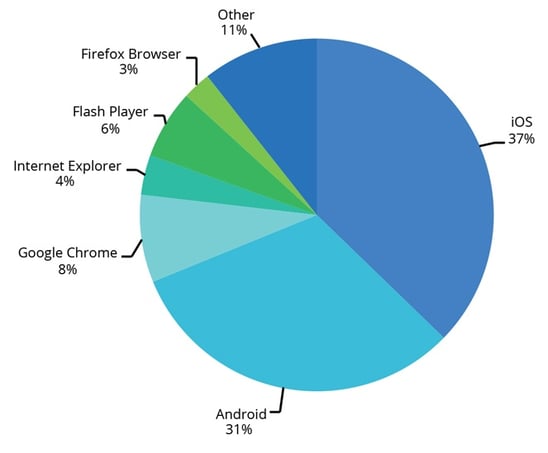
During the M-F 6A-8P daypart, 37 percent of listening took place on an iOS device, followed by Android at 31 percent, Google Chrome at 8 percent, and Flash Player at 6 percent.
Mobile Trending Up
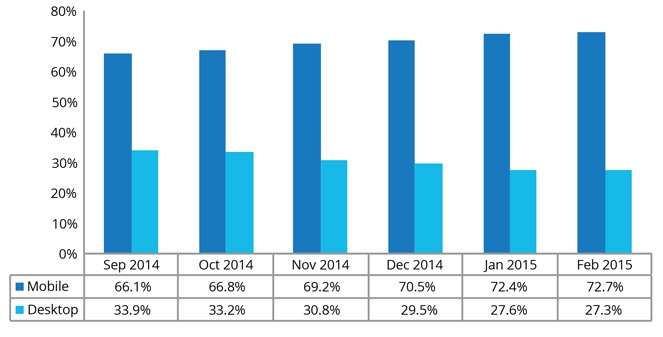
Mobile listening represented 72.7 percent (M-F 6A-8P) of total listening in February 2015, compared to 27.3 percent on desktop. Trending for the last six months is charted below.